NYC Taxi Trips
Graded mini DS project for the Database Technology class in the 4th semester Have a look at the code on my Github: Github
Libraries: Pandas, Matplotlib, Seaborn, GeoPandas
Brief Overview:
Goal
- Analyze a unique dataset
- Learn the procedure for a Data Science project
Methodology
- Analyzed three months of NYC yellow taxi trip data
What did I learn?
- Working with geospatial data in GeoPandas to create static and interactive maps
- Using Parquet file format to store data
Results
- Static and interactive maps to showcase taxi trip data in NYC
Introduction
A few years ago, I found a famous visualization that follows a New York cab for a day. Since then I always wanted to analyze NYC taxi trip data. As we should find a unique dataset for the graded project, I selected this dataset.
Data Gathering
The NYC Taxi & Limousine Commission stores a monthly record of all cab trips since 2009 (TLC Trip Record Data). On the website you can manually download the data for the individual months. I got the data via AWS, because there the data set is available as "Open Data" and you can easily access the data via the command line:
aws s3 cp --no-sign-request s3://nyc-tlc/trip\ data/yellow_tripdata_2022-01.parquet .
aws s3 cp --no-sign-request s3://nyc-tlc/trip\ data/yellow_tripdata_2022-02.parquet .
aws s3 cp --no-sign-request s3://nyc-tlc/trip\ data/yellow_tripdata_2022-03.parquet .
The data is saved in the Apache Parquet-Format which allows for a more efficient data storage and faster access, because of a mix of row-based and column-based (hybrid) storage formats. I only focussed on the yellow cabs and analyzed the trips from January till March 2022. With this I got more than 9 million trips with far exceeded the specification of the "mini DS project".
Data Cleaning
- Transformed categorical attributes from float to integer
- Encoded missing values with 99
- Calculated `trip_duration` from the difference between `tpep_dropoff_datetime` and `tpep_pickup_datetime`
- Extracted `tirp_duration_sec` from `trip_duration` to use it for calculations
- Transformed `trip_distance` to `trip_distance_km` to calculate `average_speed_km/h`
- Removed outlier using box-plots for visual assessment (there was one ride with over 85000 km, which lasts for five days and 21 hours)
- Created individual (aggregated) datasets to answer the research questions
In the end 463.285 rows were removed. Leaving 8.607.976 trips to analyze.
Questions
In this section I will show some answers fomr the research questions:
How many trips are there per hour?
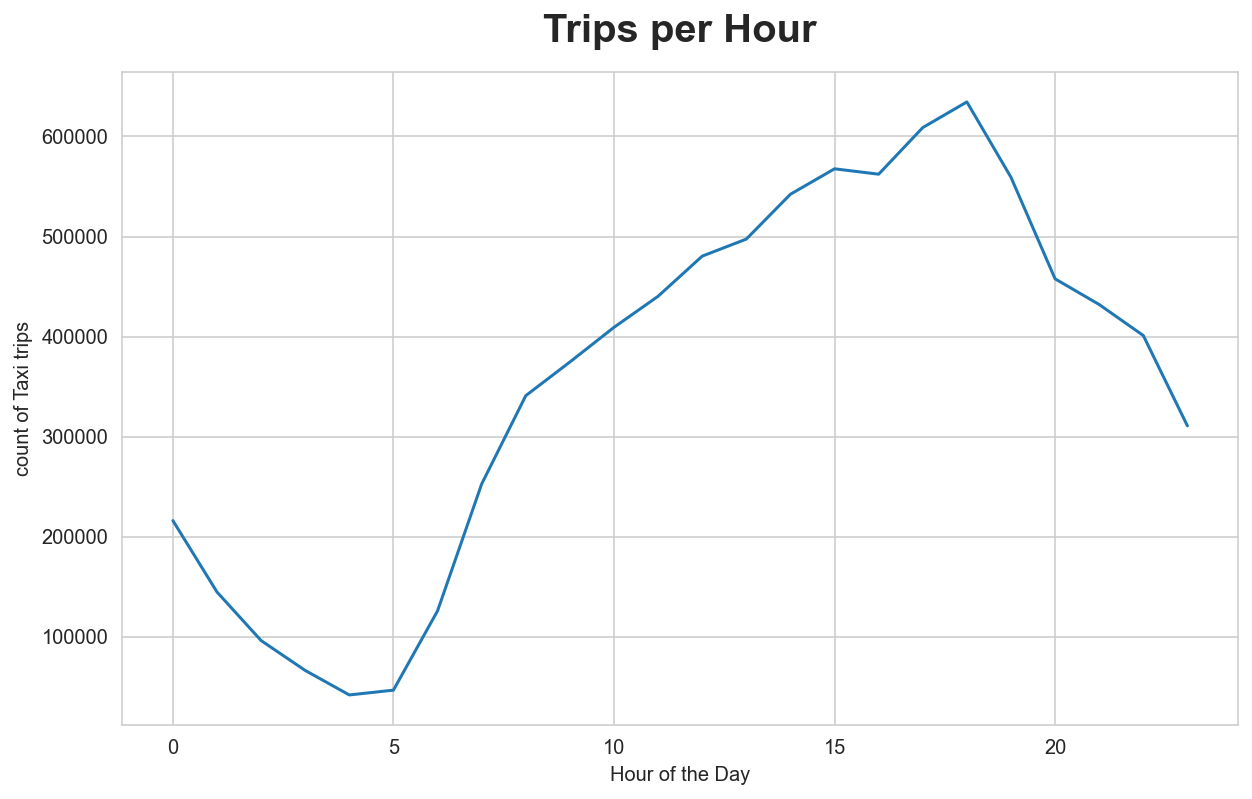
As expected, rush hour at 6 p.m. is the busiest, with an average of 7,129 trips. The fewest trips are in the morning at 4 a.m., with an average of 468. From 5 a.m. to 6 p.m., the number of trips increases steadily.
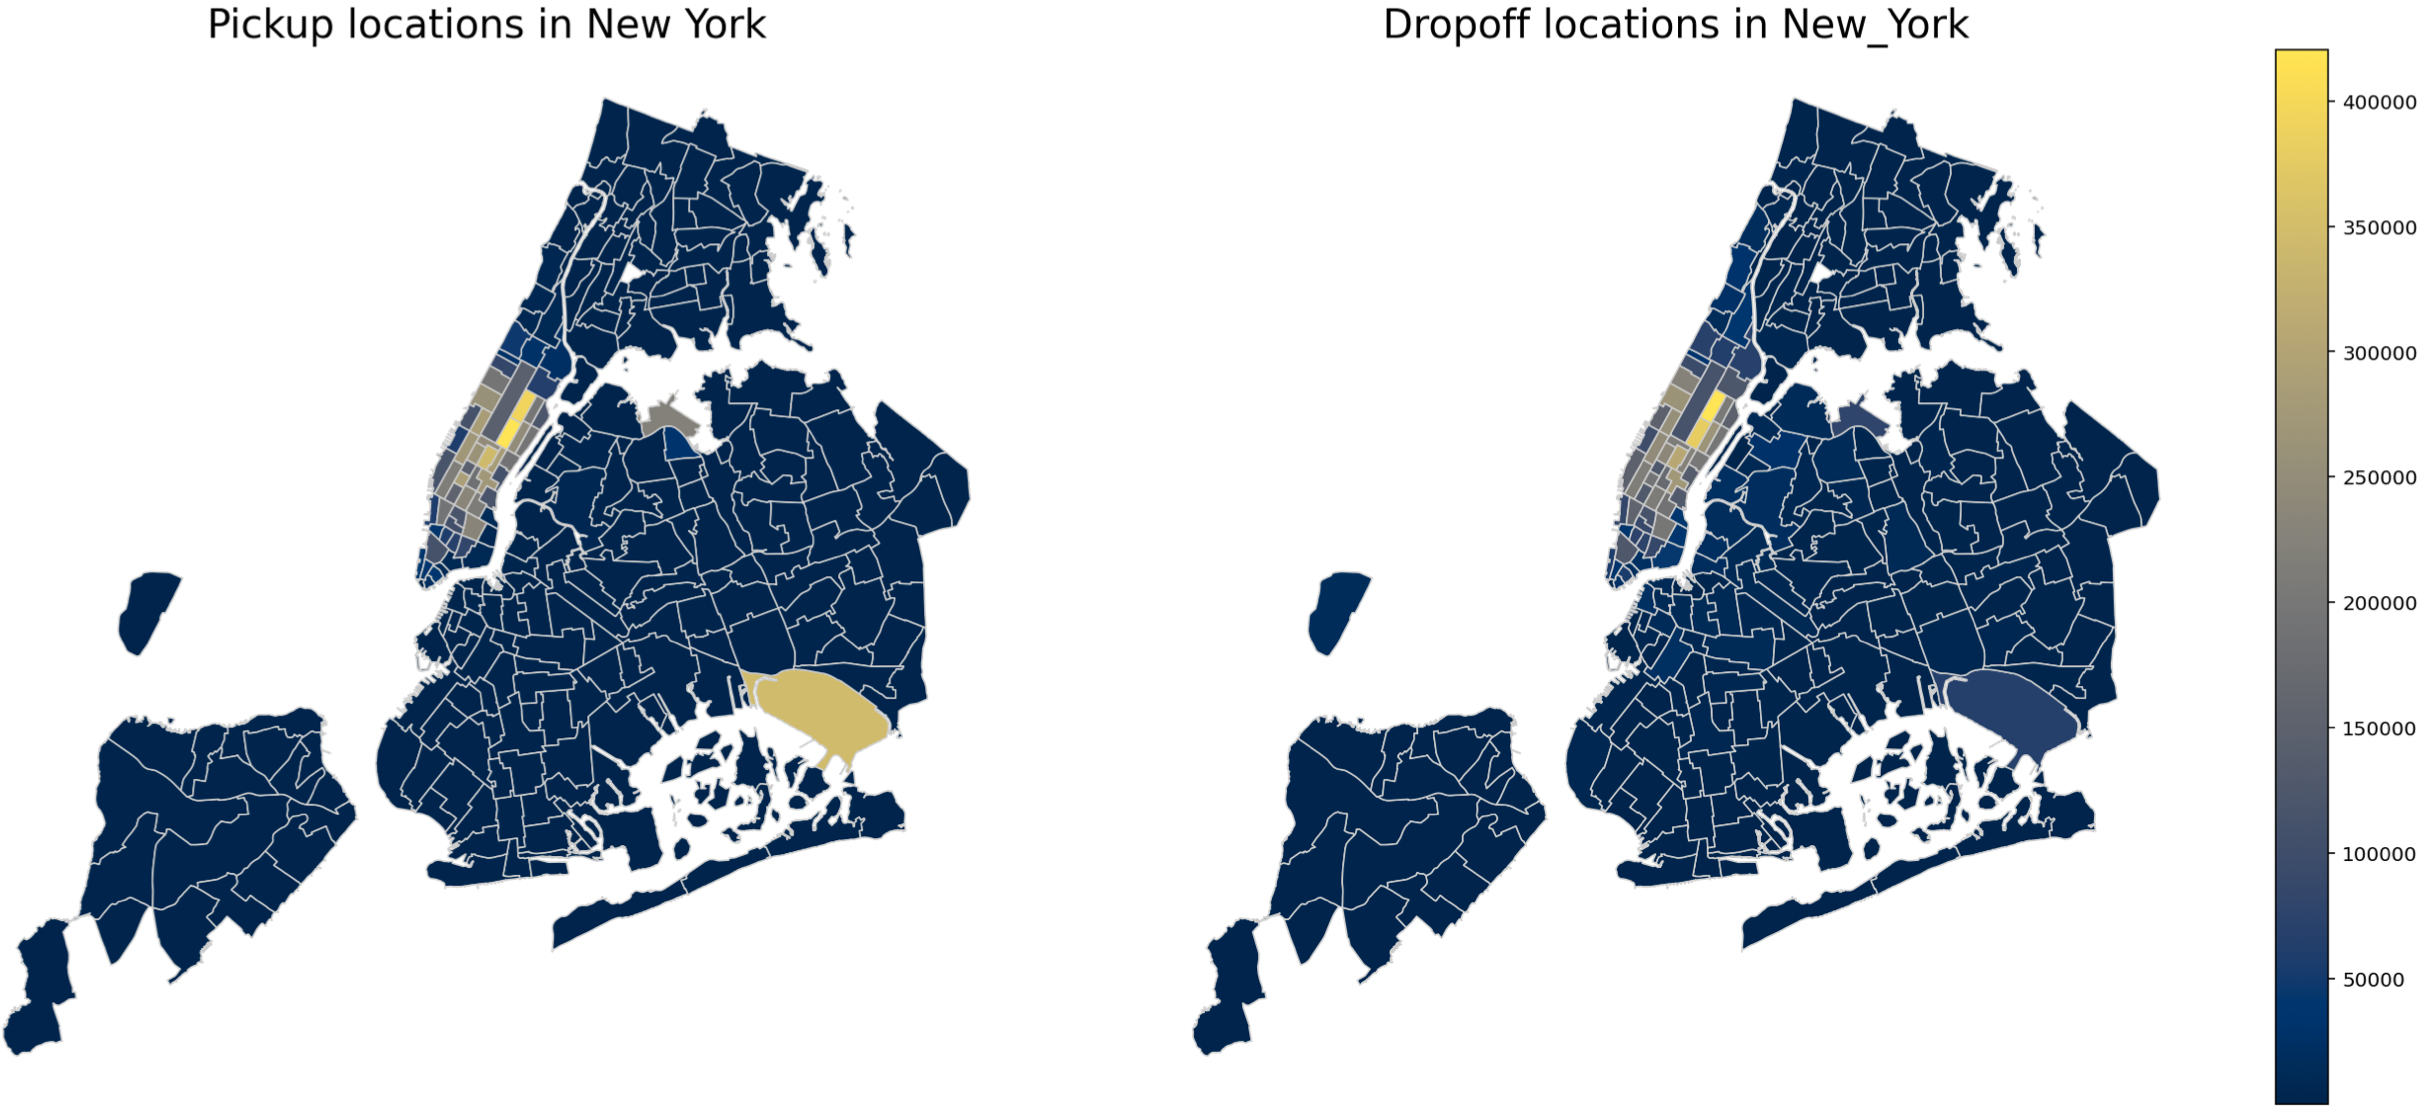
What are the most common pickup and drop-off zones?
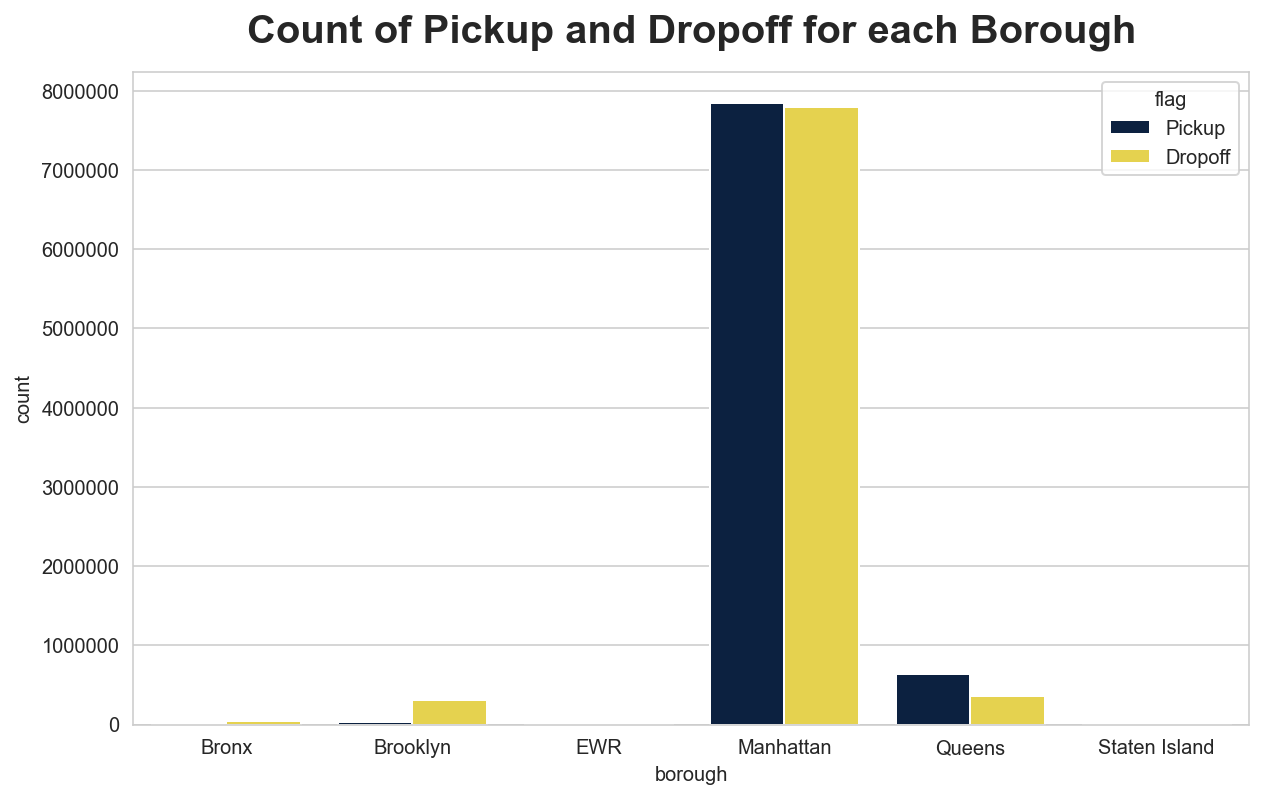
It is clear that Yellow Caps operate almost exclusively in Manhattan and in very few cases still transport passengers in Queens or Brooklyn. There is also no significant difference between pickup and drop-off zones in Manhattan. Most of the trips are in the Midtown area and around Central Park. Whereby most passengers are picked up in the Upper East Side South and dropped off in the Upper East Side North. This is also the most heavily traveled route.
Which zones are most frequently served by cabs starting from the JFK airport?
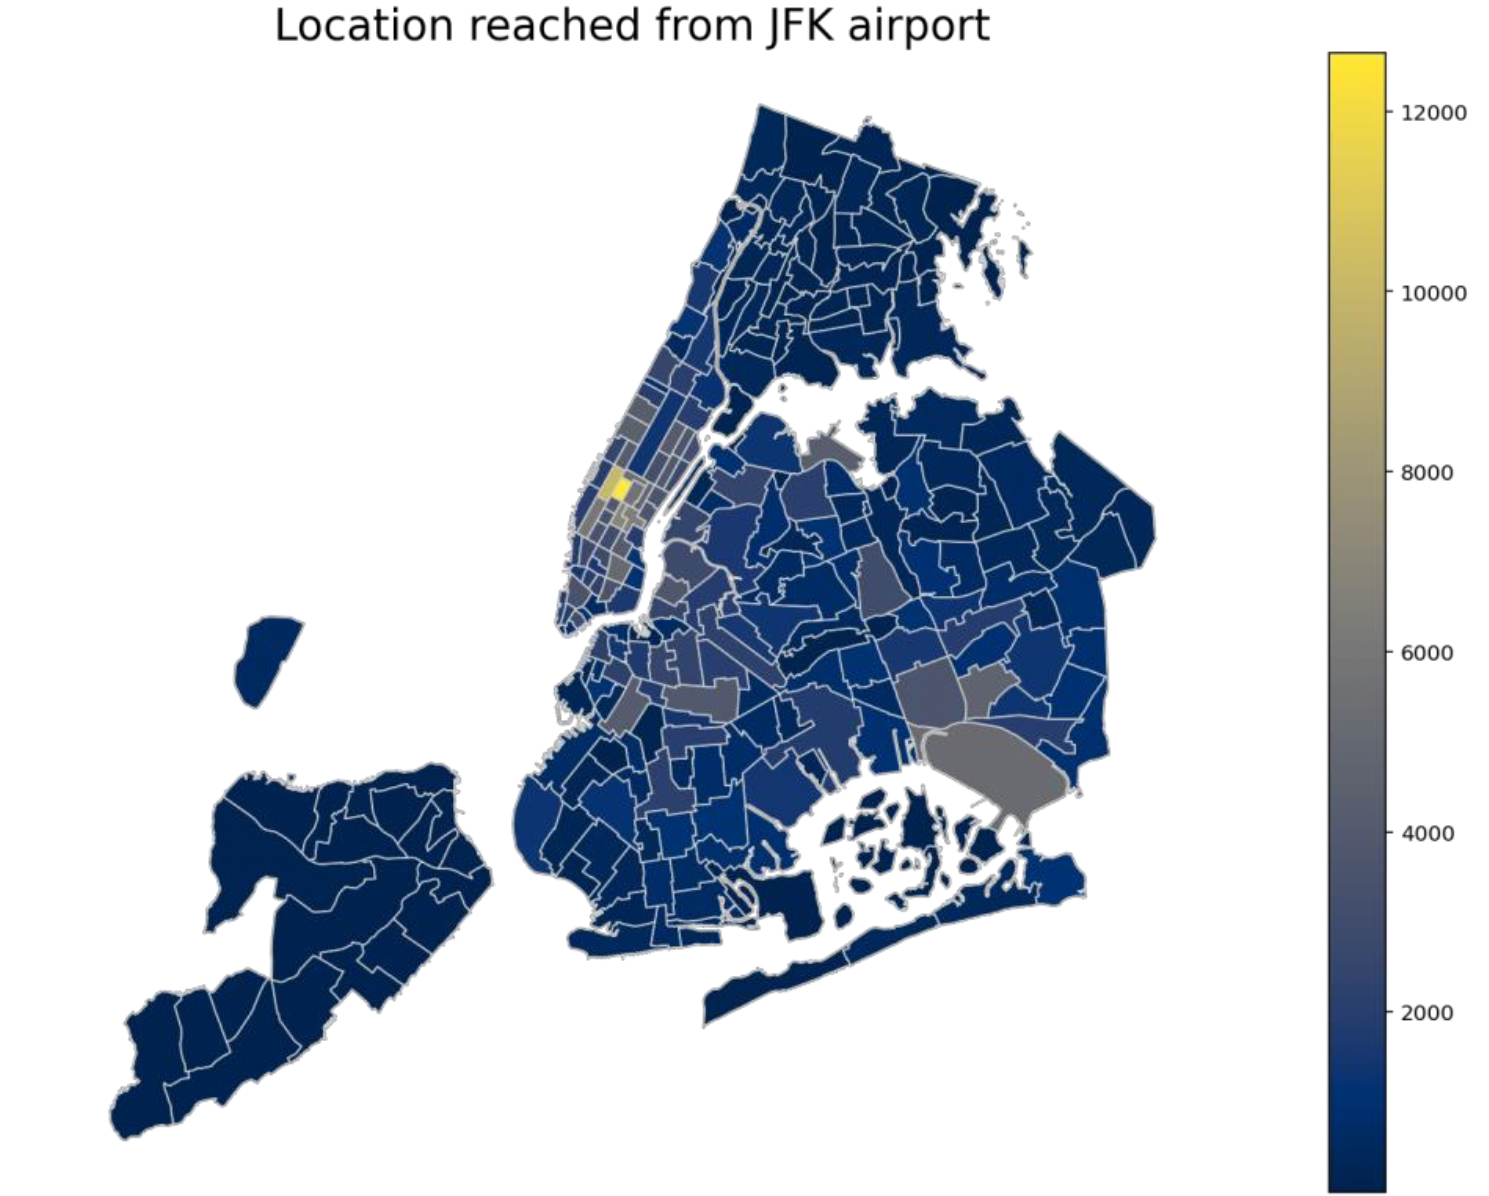
Passengers arriving at JFK Airport travel the most to Manhattan (184,318), with the TimeSq/Theatre District being the busiest with a total of 12,651. Brooklyn and Queens are destinations for over 70,000 passengers. In Brooklyn, Park Slop is the most popular drop-off zone with 4,160 and in Queens, along with JFK Airport itself, it is Baisley Park with 4,618 drop-offs.
What are the most frequently used routes?
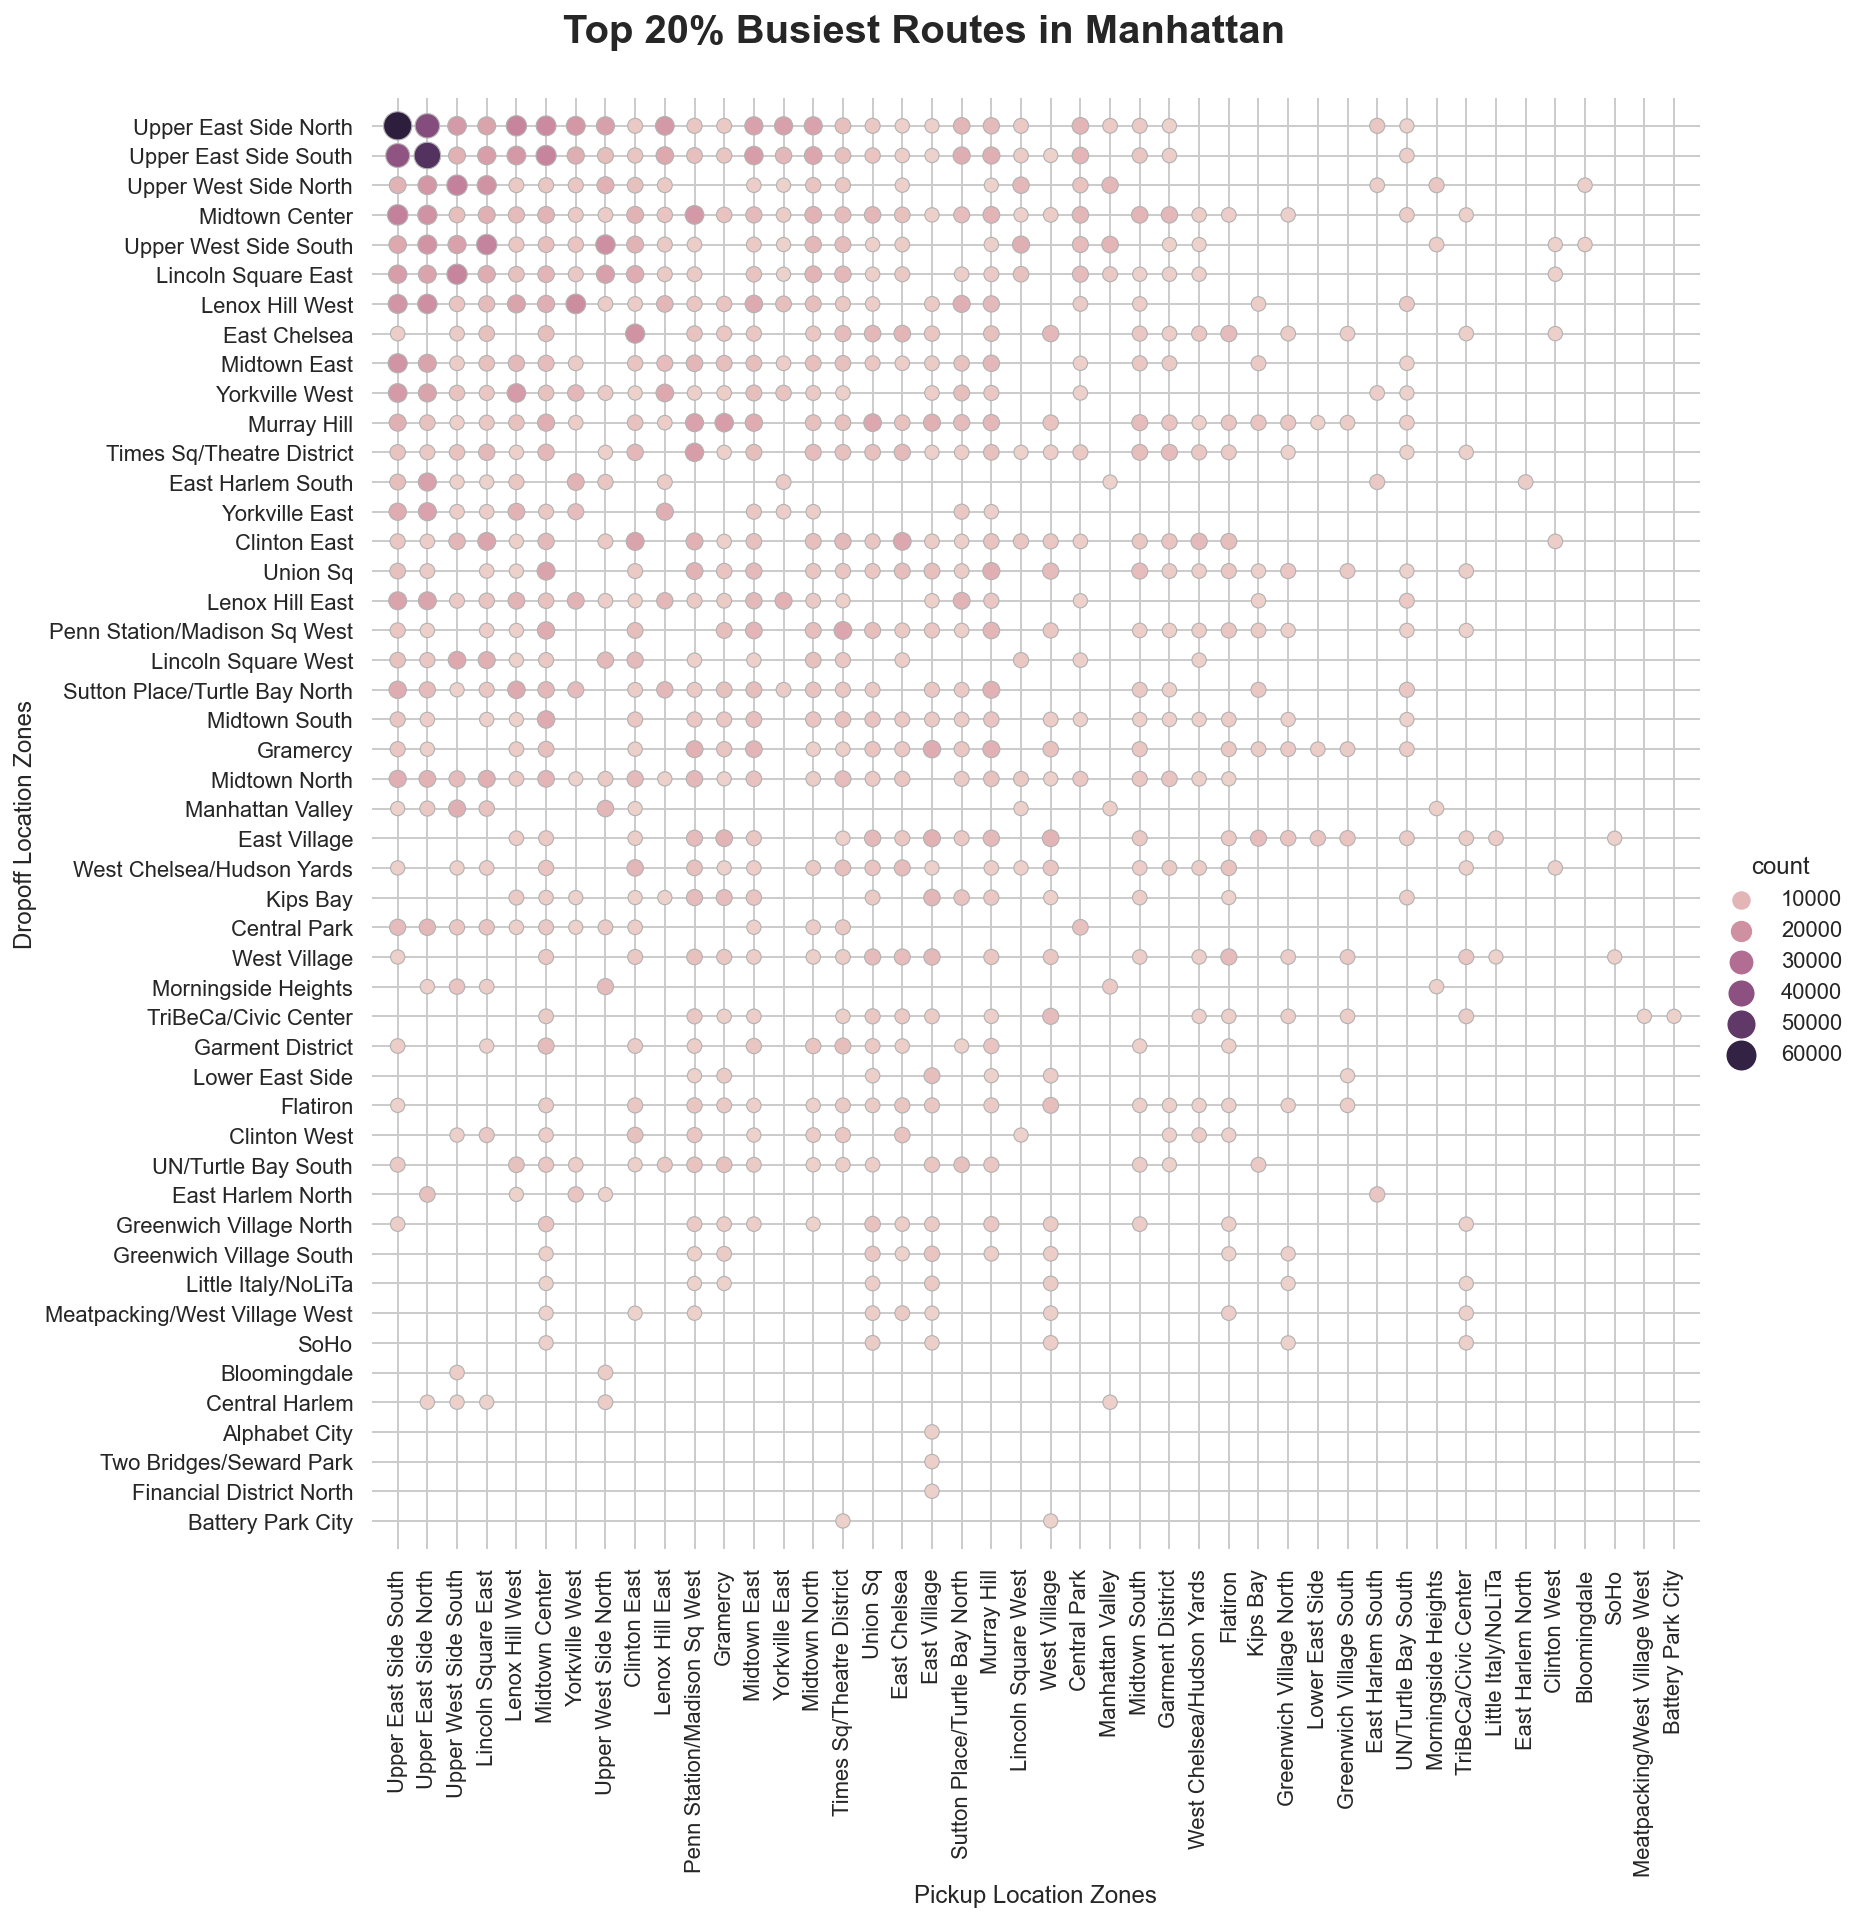
The busiest route is between Upper East Side North and Upper East Side South, with over 61,788 trips over the three-month period.