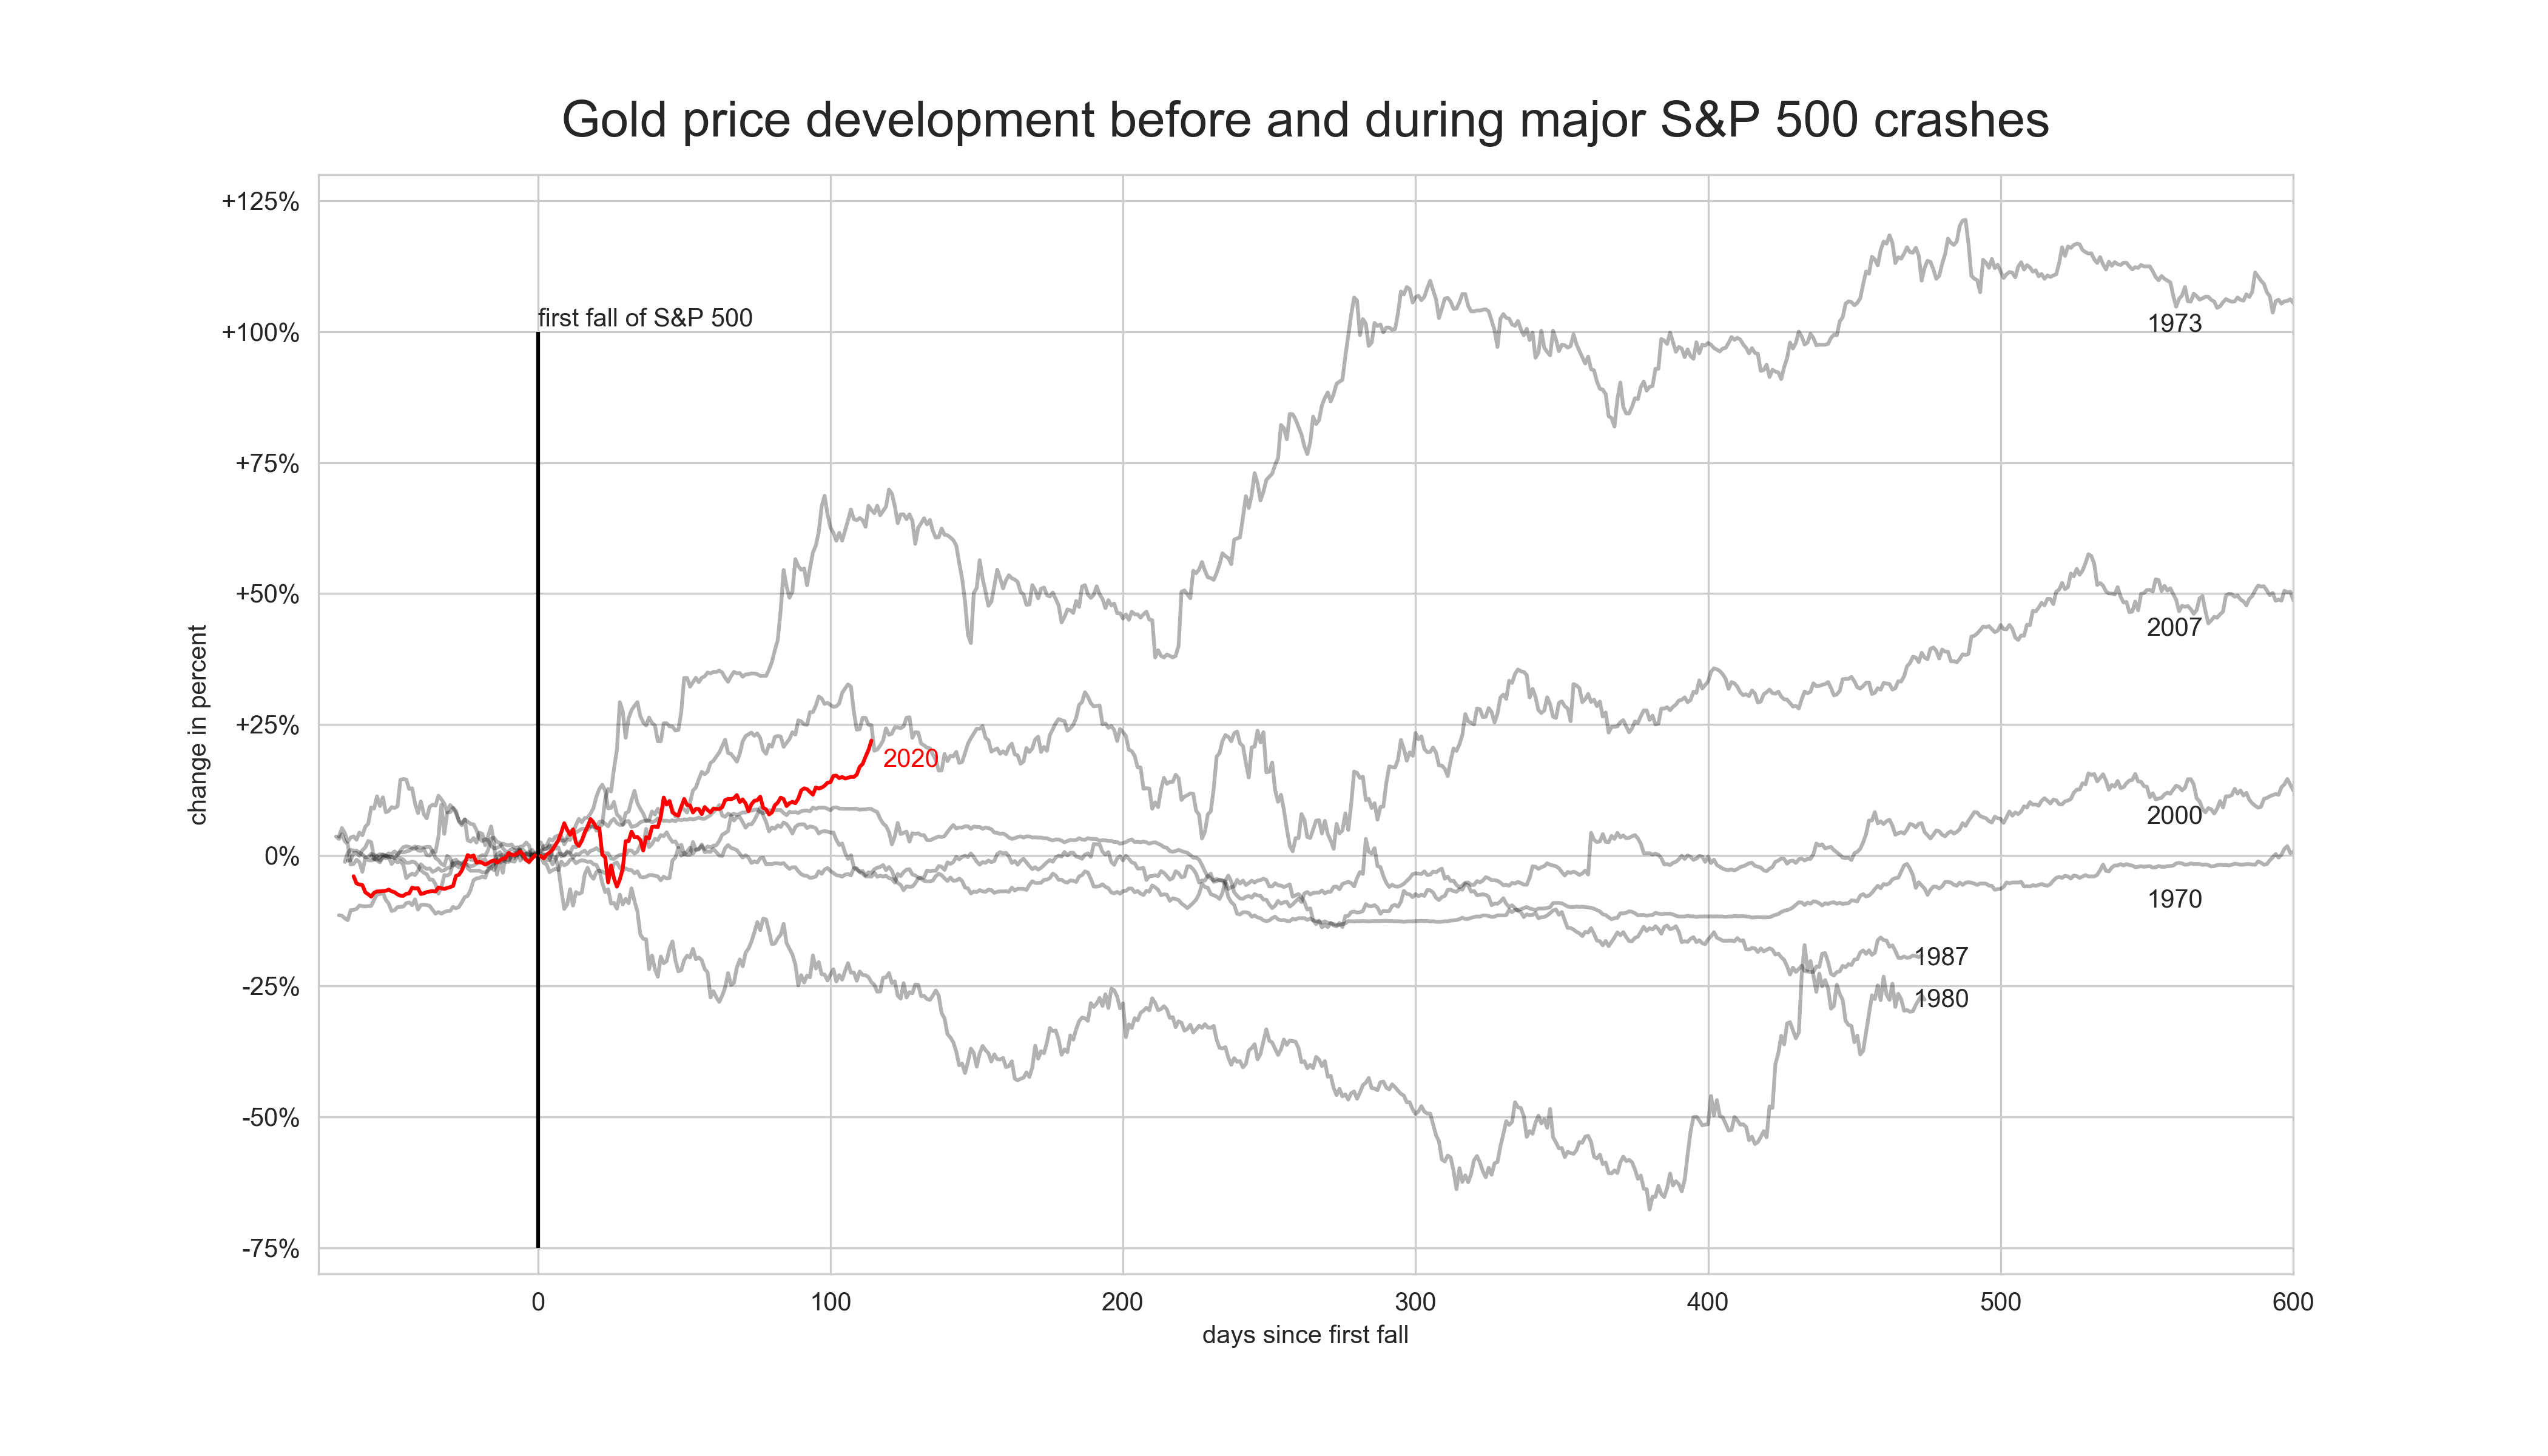
Gold price development
during major-S&P500-crashes)
Visualization of the development of the gold price before and during major crashes. Have a look at the code on my Github: Github
Libraries: numpy, pandas, matplotlib, searborn, plotly, streamlit, yahoofinancials, quandl
Brief Overview:
Goal
- Is Gold the profiteur of uncertain times?
- Visualizations that shows the progression of the gold price during different crashes
Methodology
- Gold prices are from quandl
- S&P 500 prices from yahoofinancials
- NumPy and Pandas to calculate the index prices
- Matplotlib and Seaborn to visualize
Challenges
- Start and end dates of the crises
- Visualization of all data in one chart
What did I learn?
- Working with multiple DataFrames in pandas (index, join, etc.)
- Implementing visualization libraries (Matplotlib, Seaborn, Plotly)
ToDo
- Add interactivity
Introduction
The inspiration for this analysis is this Reddit post, where the corona crash is compared to major ones in the past. As I am a stakeholder in gold I thought it would be interesting to see how the gold price develops in uncertain times. Gold is generally known as the safe haven for investors in such crises and is therefore the profiteer of uncertain times. But is this really the case?
Data Gathering
The gold price data is from Quandl. Quandl is a data provider, which offers access to all sorts of quantitative data. I used it because I can query the gold price in USD from 1968 till now for free. To identify dates for the crashes in the Reddit post, I used wikipedia and data from the S&P500, since gold is mostly traded in USD and the S&P 500 is one of the most commonly followed equity indices, and many consider it to be one of the best representations of the U.S. stock market. The range of dates is from the high before the crash to the date where the price is higher than the high before the crisis. Listed below are the start and end dates of major crashes (from 1968):
- 1970s energy crisis: 11.05.1969 - 10.05.1970
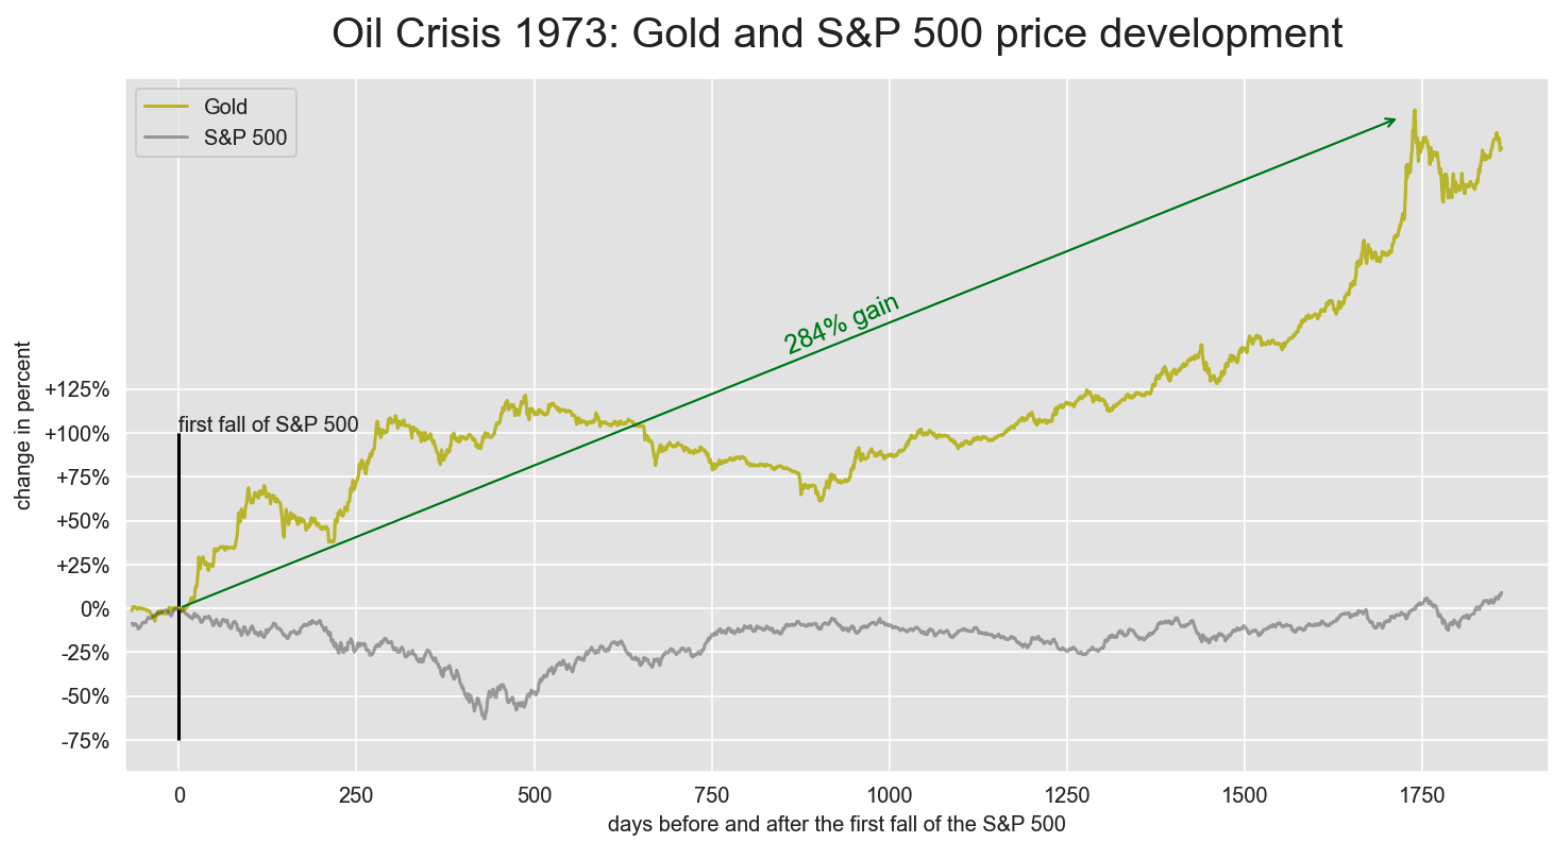
- 1973 oil crisisoil crisis: 02.01.1973 - 29.09.1974
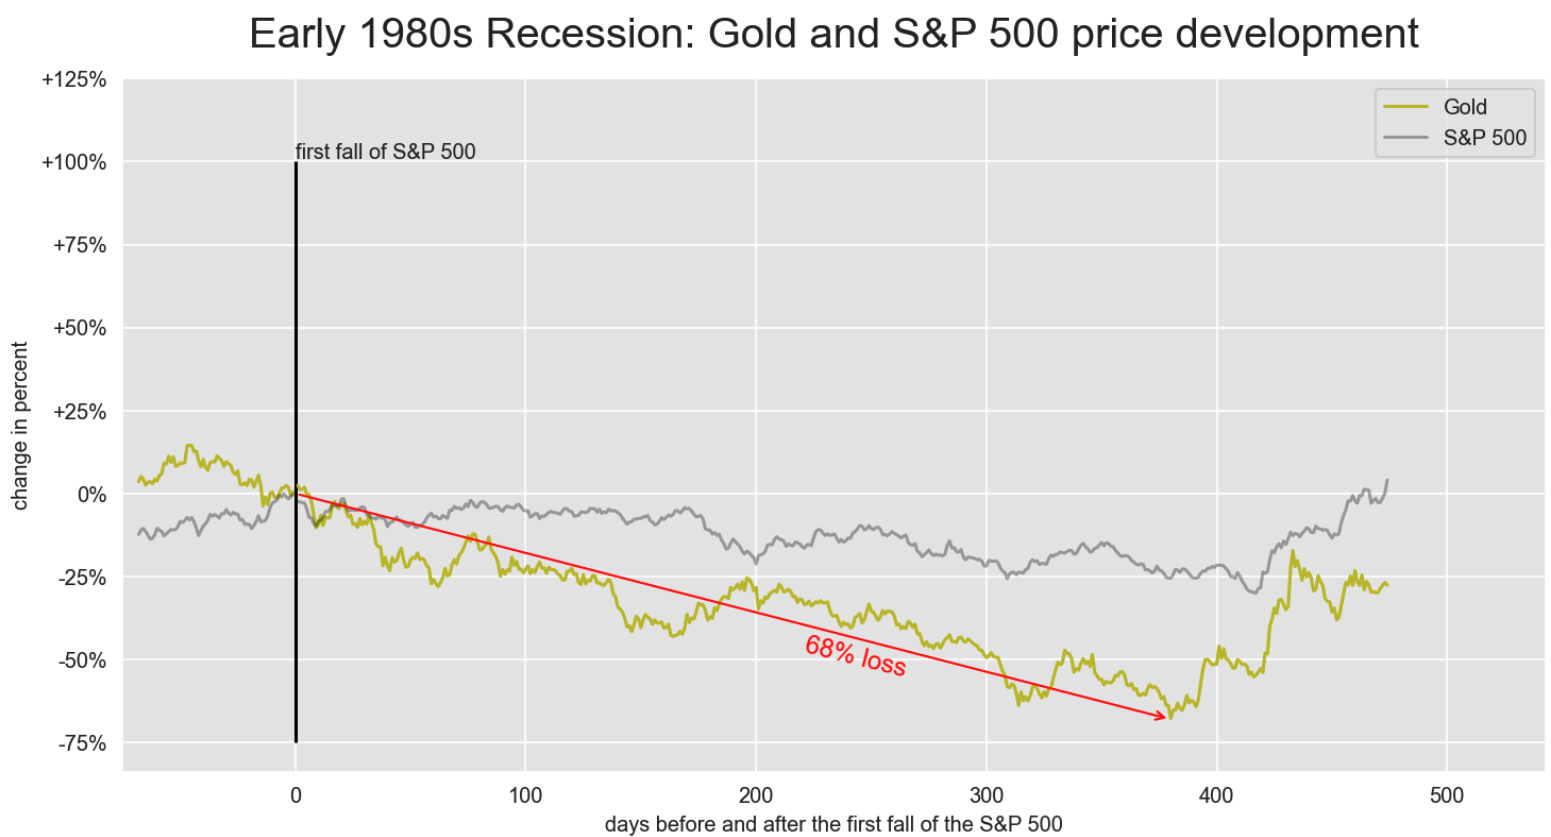
- Early 1980s recession: 24.11.1980 - 02.08.1982
- Black Monday: 17.08.1987 - 30.11.1987
- Dot-com bubble: 20.03.2000 - 30.09.2002
- Dot-com bubble: 09.10.2007 - 02.03.2009
- Corona: 19.02.2020 - 18.08.2020
What did I do?
- Queried Quandl API for gold
- Used python package YahooFinancials to get S&P 500
- Identified dates for start, lowest price of the crisis and next higher price
- Calculated the length of each crisis
- Calculated the cumulated ptc change
- Calculated the min and max percentage gain/loss in the period of the crashes
- Created a visualization with every gold price development during the crashes
- Created visualizations with a one on one comparison between gold price and S&P 500 development for every crash
Results
For the most time the Gold price was higher then before, when the S&P reached the same price as before the crisis. Only in two instances gold performed weaker than the S&P 500 (early 1980s recession, Black Monday). The highest gain was after the oil crisis in 1973 with a max gain of 284% and the biggest decrease in gold value was -68% during the early 1980s recessions: